Shrinkage and waste control template in Excel
Shrinkage and waste control template in Excel
Shrinkage is one of the quietest money leaks in any business: you buy, receive and pay for stock in full, yet part of that merchandise is never sold or used. It expires on the shelf, gets damaged in the storeroom, is lost through a recording error or disappears without explanation. Because each individual case looks small, many companies never measure what all those losses add up to at the end of the month, and what is not measured cannot be fixed. This article brings you a shrinkage and waste control template in Excel, ready to download, explained field by field and accompanied by a worked example, so you can put it to work from today.
The file is an internal-control tool: it exists to record, measure and analyze losses, not to settle taxes or replace any accounting or fiscal document required by law. It also has no fixed currency: quantities and values are entered as plain numbers, so the same template works with dollars, pesos, reais, euros or any other currency. You decide which unit value to record —for instance, the latest purchase cost— and the file takes care of the rest.
⬇ Download shrinkage and waste control template (.xlsx)What shrinkage is and why you should control it
In practical terms, shrinkage is the difference between the merchandise a business receives or buys and what it actually manages to sell or use. That difference can be physical, when the product no longer exists because it was damaged, expired or misplaced; or it can be a recording difference, when the product exists but the paperwork, the stock card or the count says otherwise. Waste is the most visible face of shrinkage: food that is thrown away, material that is discarded or product that ends up in the trash without ever fulfilling its purpose. In food, beverage and perishable businesses, shrinkage is a permanent operating cost; in general retail it appears as shortages, returns and adjustments.
Controlling it matters because every lost unit has already been paid for: it is money that left the cash register and will never come back through a sale. Shrinkage hits the margin directly and, in many cases, explains why a business sells a lot and still does not see profits. Once a loss is recorded, it stops being a rumor and becomes a fact: you know which product fails, in which area, how often, how much it costs and who was involved. With that information, purchasing, storage and staff-management decisions stop being guesses and start being based on evidence. A well-kept shrinkage log will not eliminate losses by magic, but it makes them visible, and what is visible always ends up shrinking.
Four causes, four clues for action
Most shrinkage falls into four causes. Classifying every event is not bureaucracy: each cause points to a different solution, and that classification is what later lets you summarize the data by cause.
| Cause | When it happens | Typical example |
|---|---|---|
| Expiry | The product reaches its date limit before being sold or used | Yogurt that passes its expiry date in the store refrigerator |
| Damage | Bumps, breakage, spills or poor handling during receiving, storage or transport | A box of eggs crushed when other merchandise is stacked on top |
| Error | Recording failures: a quantity is typed wrong, a count is off or stock is booked to the wrong item | Ten units are received, eight are recorded and the shortage shows up in the count |
| Theft | Intentional removal by customers, suppliers or internal staff | Merchandise that disappears from the storeroom with no recorded movement |
The four causes are treated differently: expiry is tackled with better purchase forecasts and stock rotation; damage, with order, packaging and handling training; error, with recording procedures and double checks; and theft, with restricted access, cameras and clear responsibilities. That is why the template keeps them separate from the very first row.
What the shrinkage and waste control template includes
The template is designed so that recording is fast: the person who detects a loss does not need to be an Excel expert. They simply complete one row, pick the cause from a list and the file calculates the value lost and adds it to the summary. These are its components:
| Component | What it is for |
|---|---|
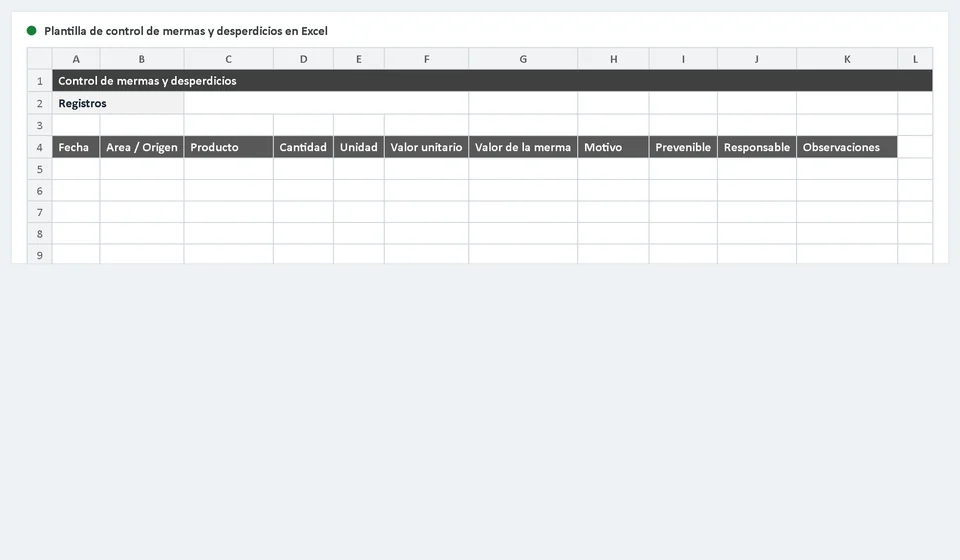
| Shrinkage log | Main sheet where each loss event occupies one row with its date, area, product, quantities, cause and person responsible |
| Drop-down cause list | Prevents typing errors and made-up labels: the cause is chosen from expiry, damage, error and theft |
| Calculated value column | Multiplies the quantity by the unit value automatically, with no calculator and no mental math |
| Preventable? column | Forces each loss to be classified as avoidable or not, separating what can be corrected from what cannot |
| Summary by cause | Automatically totals the value lost by cause and by area, so the information can be read at a glance |
| Instructions sheet | Explains the step-by-step process inside the file itself, so the team does not depend on this article to start |
The log columns, one by one
Each row of the log describes a complete loss event. Before filling it in, it helps to understand what every column asks for and why it is there:
| Column | What you record |
|---|---|
| Date | The day the shrinkage was detected |
| Area | The section where it happened: kitchen, storeroom, sales floor, dispatch or another |
| Product | The name of the affected item, exactly as it appears in your product list |
| Quantity | The units or kilograms lost, in the same unit you buy in |
| Unit value | The estimated cost of each unit, normally the latest purchase cost |
| Calculated value | The result of multiplying quantity by unit value; the cell does it on its own |
| Cause | The reason chosen from the list: expiry, damage, error or theft |
| Preventable? | Whether the loss could have been avoided with better control; marked yes or no |
| Person responsible | The person who detected the event and records it, so it can be discussed if needed |
There is no selling-price column: shrinkage is valued at cost, because what you lose is not what you were going to charge, but what you already paid. Valuing at cost keeps you from inflating the loss with a margin that was never earned.
Worked example: two kilograms of expired tomato
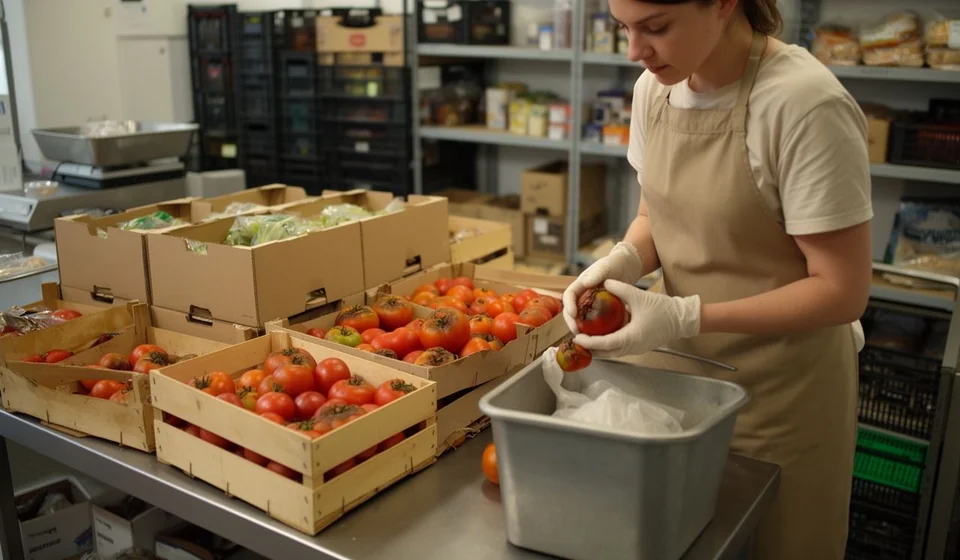
To see the template in action, imagine a restaurant that finds two kilograms of expired tomato in the kitchen. The latest purchase cost of the tomato was 6,000 per kilogram. The person in charge opens the log and completes the row like this:
| Date | Area | Product | Quantity | Unit value | Calculated value | Cause | Preventable? | Person responsible |
|---|---|---|---|---|---|---|---|---|
| 05-Sep | Kitchen | Tomato | 2 kg | 6,000 | 12,000 | Expiry | Yes | Maria Lopez |
The calculated value is the result of multiplying the quantity by the unit value: two kilograms times 6,000 equals 12,000. Notice that the number carries no currency symbol, because the template is designed to work with any currency: if your business operates in another currency, the same calculation applies to your figures. That single event looks minor, but if it repeats several times a week across several products, the month-end summary will show a figure that justifies changing the way you buy.
The row also says two important things: the cause was expiry and the loss was preventable. That invites the question of why more tomato was bought than the kitchen consumed, whether orders are based on real usage, and whether older products are used first. If the answer is that there is no rotation rule, the solution is not to buy less blindly, but to match purchase quantities to demand and organize the refrigerator so that what expires first is used first. One well-filled row can improve the whole operation.
How to use the template, step by step
Setting up shrinkage control takes less than an hour. The recommended order is this:
- Download the template and open it in Excel, LibreOffice Calc or your favorite online spreadsheet.
- Read the instructions sheet inside the file: it summarizes the purpose of each column and the basic rules.
- Fill in your business details if the template includes them: establishment name, main area and working month.
- Record each loss the moment it is detected, not at the end of the week: memory distorts quantities and causes.
- Always pick the cause from the drop-down list and avoid writing free-form reasons that cannot be summarized later.
- Check that the quantity and the unit value are correct; the calculated value updates by itself.
- Mark the preventable? column with honest judgment: if the cause could have been avoided with better control, it is yes.
- Review the summary by cause every week or every two weeks and note which product and which area concentrate the largest loss.
Tips to make the control actually work
A template controls nothing on its own: the team's discipline is what turns the file into a tool. These tips make the difference between a log abandoned after two weeks and one that improves business results:
- Record at the moment: a loss written down three days later usually comes with invented or incomplete data.
- Always mark the preventable? column: it separates the losses you can attack from those you must accept as part of the operation.
- Review the summary by cause on a fixed schedule: set aside ten minutes a week to read what is happening.
- Assign a clear person responsible for filling in the log and validate that rows are complete before closing the period.
- Use the latest purchase cost as the unit value and update it when the price changes significantly.
- Do not use the log to punish people: use it to find weak processes; once the team understands that, it stops hiding losses.
- Complement the control with periodic counts: recorded shrinkage that does not match physical reality means something else is going on.
When it is time to move to inventory software
The Excel template delivers a lot while the volume of events is manageable: one business, one file, one person a day. But the control has natural limits. When several people need to record losses at the same time, when there is more than one site or warehouse, when shrinkage must be cross-checked against purchases, sales and physical counts, or when you need to know expiry status in real time, the spreadsheet starts to fall short and to consume more time than it saves.
That is where specialized software takes over. Kardex Tauro records each loss as a movement linked to a product, so the shrinkage deducts from the stock-card balance instantly, can be classified by cause and is available in reports for data-driven decisions. The template also works as a bridge: the records you fill in today show you exactly what information the system will need tomorrow, and let you arrive at it with your house in order.
Frequently asked questions
What does a shrinkage log record?
Which product was lost, how much, for what cause (expiry, damage, theft or handling error) and the value of that loss.
How is shrinkage calculated?
By comparing what should be there —purchases minus sales— with what the count shows. That difference is the shrinkage, and without a count it does not exist.
What do you do with the result?
Split it by cause: what can be prevented (rotation, handling, ordering) and what cannot. Only the first gets acted on.
There is no single rule for the moment of change; the signal is practical: when keeping the file up to date competes with actually running the business, it is time to automate. Until then, start with this template, make shrinkage a visible figure and turn every loss into a decision. Controlling shrinkage is one of the fastest ways to recover margin without selling a single extra unit.
⬇ Download shrinkage and waste control template (.xlsx)