Physical inventory count sheet template in Excel: free download

Physical inventory count sheet template in Excel: free download
If your inventory system records every item in and out, why bother counting by hand? Because the system does not always tell the truth. A purchase that was received but never entered, a sale that left without an invoice, a product stored in the wrong spot, shrinkage nobody documented, or a typo in a quantity: all of that makes your records say one thing while the shelf shows another. A physical count is the one moment when you compare what your records claim with what actually exists, and that exercise almost always ends in surprises: extra units, missing units, and products that show up where they should not be.
Counting physically is not a year-end formality. It is the basis for a true inventory value, for catching losses early, and for giving an auditor real support for your numbers. In this article I share a physical inventory count sheet template in Excel, free to download, with a double count, automatic difference calculation, and a dedicated sheet for approved adjustments. You use it as is: set the date and the zone, print the sheet or fill it on a tablet, count, and let the formulas do the rest.
⬇ Download physical inventory count sheet (Excel .xlsx)What the template includes
The file is in English, works in Excel and Google Sheets, and has two worksheets plus an instructions sheet. You do not need spreadsheet skills: the cells that calculate themselves are already programmed.
| Sheet | What it contains and what it is for |
|---|---|
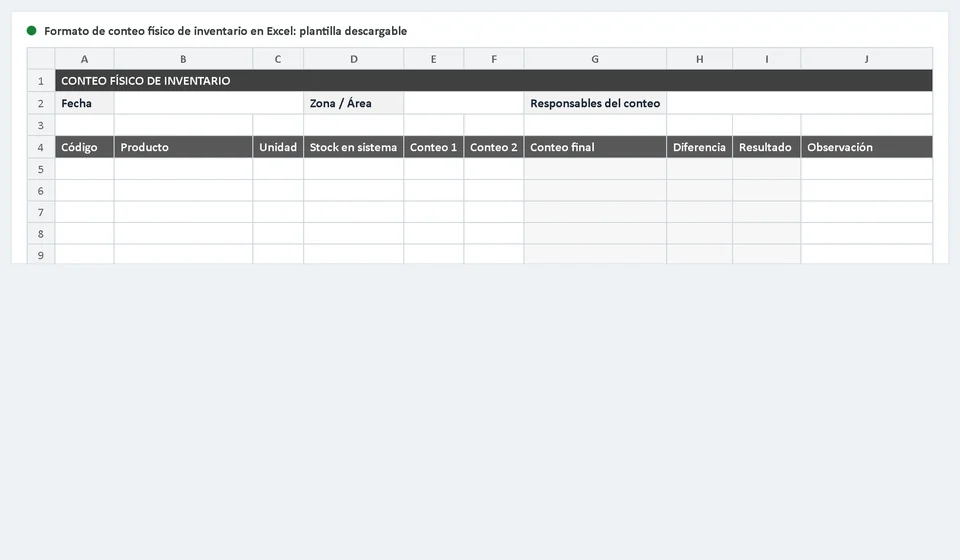
| Count | The count form: a header with date, zone or area and the people responsible, plus a 100-row table with filters to record each item's code, product, unit and system stock. |
| Adjustments | Log of the approved adjustments after the count: date, code, product, quantity, reason from a drop-down list, supporting document and approved by. |
| Instructions | Quick guide with the step-by-step process, an explanation of every column and tips to get the count right the first time. |
In the Count sheet, every row has three groups of columns: the product data (code, product, unit and system stock), the two counts (Count 1 and Count 2) and the calculated columns: Final count, Difference and Result, plus an Observation column. The Final count is automatic: it takes Count 2 when it exists and Count 1 otherwise. The Difference subtracts the system stock from the final count, and the Result fills itself in: No variance when the difference is zero, Overage when it is positive and Shortage when it is negative. Below the table, a summary adds up the total overage and the total shortage for the zone, so you can see at a glance how much needs to be investigated and adjusted.
How to organize a physical count
An organized count is done by zone. If you split the warehouse into sectors, such as shelf 1, shelf 2, cold storage or the mezzanine, you can assign one zone to each team, print only that zone's sheet and finish the job in stages, without shutting the whole business down for days.
The golden rule is a double count with independent counters: two people count the same product without looking at each other's results, and only then are the figures compared. If Count 1 and Count 2 match, that is the number. If they do not match, a third count is done to decide which one is right. That is why the template has two count columns and the Final count prefers the second one: the one recorded as the verification pass.
On count day, try to freeze movements: no goods in or out of the zones being counted. If the business cannot stop completely, physically separate whatever comes in or goes out and record it apart, so it does not contaminate the figures on the sheet. It also helps to mark what has already been counted, with tape, a sticker or a checkmark on the sheet, so you neither count a product twice nor skip one. A zone of about 150 items takes around 1.5 hours with two counters, so plan the routes ahead of time. When the zone is done, each team signs and hands in the sheet with date, zone and the people responsible in the header.
Example with numbers
Here is how the Count sheet reads, using four example products. The numbers are units:
| Product | System stock | Final count | Difference | Result |
|---|---|---|---|---|
| Box of screws 3/8 | 12 | 12 | 0 | No variance |
| LED bulb 9 W | 8 | 7 | -1 | Shortage |
| Lubricating oil 20W-50 | 15 | 17 | +2 | Overage |
| All-purpose cleaner 1 L | 6 | 0 | -6* | Pending recount |
The first row is the best news: the system says 12, the shelf holds 12 and the difference is zero. Result: no variance, and there is nothing to adjust. The second row shows a shortage: the system records 8 units and only 7 exist, so the difference is minus one unit. The third row is an overage: there are 17 units when the system says 15, two more than recorded. Both differences are investigated before touching the numbers in the system, as I explain in the next section.
The fourth row is the case that prevents the most mistakes: the product did not show up in its zone during the first pass, so the count stayed at zero and the formula marks a provisional difference of six units. A zero like that is almost never true: the product may be misplaced, pending receipt, in the wrong warehouse or already sold without being recorded. The right move is to recount and search before accepting the shortage; only if it still does not appear after checking do you adjust. On the sheet, that case is noted in the Observation column as a pending recount and is not mixed with confirmed results.
What to do with the differences
The rule is simple: investigate first, adjust second. When goods are missing, check unrecorded sales, miscounted receipts, returns that never made it back to the shelf, shrinkage that was never documented and half-finished movements from the period. When there is an overage, think of purchases received but not entered, customer returns and units that went out by mistake in a shipment. Many differences are resolved by finding the product two aisles away or a document that was never posted.
What you should never do is correct the system on the fly, with no record and no control. Every approved adjustment goes into the Adjustments sheet with the date, the code and the product, the quantity being adjusted, the reason chosen from the drop-down list (overage, shortage, shrinkage or damage, recording error or other), the supporting document and the person who approves it. With that you update the stock in your system or in your stock card and leave a clean trail: any auditor, accountant or business partner can understand why a number changed and who approved it. The Adjustments sheet is exactly what turns a count into reliable control instead of a simple paperwork exercise.
How to use the template step by step
- Download the file and save one copy per count, named with the date and the zone, for example physical-count-2026-09-15-zone-a.
- Define the warehouse zones and assign people responsible; type the date and the zone into the header of the Count sheet.
- Review the product list: if you work from a master list, paste code, product, unit and system stock into the 100 rows and turn on the filters to search quickly.
- Print each zone's sheet or carry it on a tablet; count with two people: one records Count 1 and the other Count 2, without looking at each other's results.
- Check that the Final count and the Difference were calculated in every row; if a count is stuck at zero or the figures do not match between the two passes, recount before moving on.
- Note in the Observation column anything that matters: product in another zone, open package, pending recount, incomplete lot.
- When the zone is done, review the summary totals of overage and shortage and investigate every difference with its documents.
- Record the approved adjustments in the Adjustments sheet with reason, document and approved by; update the system stock with those figures and save the file as evidence.
Common mistakes
Counting without a prepared sheet. If the team reaches the shelf without the zone's list, they count products that are not in the register, skip others and the data ends up on loose papers that get lost or written down twice. The sheet with the list already loaded is the map of the count: every row is a product that must show up, no exceptions, and the filters help you track progress.
Not documenting adjustments. Fixing the stock directly in the system because it makes no difference is the most expensive mistake: a month later nobody knows why the figure changed, the real shortage stays hidden and the auditor has no support. Every adjustment, even a single unit, goes through the Adjustments sheet with reason, document and approval.
Having the same person always count. If the person who counts is always the same one and repeats the same judgment error, for example counting sealed packages as loose units, the mistake doubles and nobody notices. Rotate the counters between zones and between periods, and demand the independent double count: that simple practice catches most errors before they reach the system.
From manual counts to cycle counting
The full physical count, the one that freezes the warehouse once or twice a year, is necessary, but it has a flaw: months can pass between one count and the next while differences pile up unseen. Cycle counting solves that: instead of counting everything at once, you count a small group of products every week or every month, the highest-turnover, highest-value or most error-prone ones, without stopping operations. Problems are caught early, the work is spread out and the numbers in the system stay close to reality all year long.
To move from manual counts to cycle counting, every count must stay documented, and that is where technology comes in. Kardex Tauro is a system that is honest by design: it guides your counts, telling you which group to count today and recording who counted each product, and it keeps adjustments traceable, because every stock change carries its date, reason, document and approval. It is the natural next step after this template: first you bring order to the process with the format in Excel and, as the business grows and counts become frequent, Kardex Tauro links the counts to the stock card and to the costs, leaving no gaps where differences can hide.
Frequently asked questions
What should a physical count sheet contain?
Product, code, location, counted quantity, system quantity and the difference.
Who should count?
Someone other than the person who runs the inventory. If the same person counts, the difference goes undetected.
What do you do with a difference?
Investigate before adjusting: it may be a counting error or a real control problem. Adjusting without investigating hides the second one.
Your inventory system is a tool, not an absolute truth: reality lives in the warehouse, and the physical count is the bridge between the two. With this physical inventory count sheet template in Excel you have the essentials to do it well: double count, automatically calculated differences, totals per zone and a formal log of approved adjustments. Download it for free, run your first count on one small zone and compare it with what your system says; the results will surprise you.
⬇ Download physical inventory count sheet (Excel .xlsx)