Annual budget for a small business: how to build it and control it

Annual budget for a small business: how to build it and control it
An annual budget is not the table you put together in December, approve and file away. It is a monthly comparison between what you planned and what happened, with a decision every time a gap shows up. If your company's budget lives in a file nobody has opened since February, you do not have a budget: you have paperwork. What follows is the full build —sales, costs, purchases, staff and cash— with a worked example in Colombian pesos that balances, and a way to review it month by month without rebuilding it.
What budgeting is and what it is not
Budgeting means committing numbers to owners and dates. Every line should answer three questions: how much, who, and on what basis. A line with no owner will not be explained when it drifts, and a line nobody explains ends up adjusting itself by year end.
It is not guessing the future. A budget is a set of explicit assumptions about sales, prices, costs and payment terms, and those assumptions can be reviewed and argued about. Nor is it a motivational target. If the sales figure is the one the owner wants to see rather than the one operations can sustain, everything else is built on sand: purchases, staff and cash end up sized for a business that does not exist.
And it is not accounting. Accounting records what happened; the budget defines what is expected to happen and becomes the yardstick to measure it. They are two different exercises and neither replaces the other.
The pieces: sales, production or purchases, expenses, investments and cash flow
The master budget is built in blocks that feed each other, in an order worth respecting: sales first, then what must be produced or bought to deliver those sales, then the expenses that keep the operation running, investments on a separate track, and cash flow last, because that is what tells you whether all of the above is payable.
Start with expenses and the budget becomes the sum of what each area asked for. Start with cash and you end up with a number nobody can trace.
| Block | What it contains | Who owns it | When it closes |
|---|---|---|---|
| Sales | Units, price, mix, discounts and receivables | Sales management | Before any other block |
| Production or purchases | Units to make or buy, consumption per unit, waste | Production or purchasing | After sales |
| Operating expenses | Payroll, rent, utilities, freight, advertising | Administration and finance | After production |
| Investments | Equipment, fit-out, technology, vehicles | General management | In parallel with expenses |
| Cash flow | Collections, payments, taxes and debt service | Finance or accountant | Last, with everything above |
How to project sales on a real basis, not on wishes
A sales projection rests on three things: what the company actually sold, the capacity it has to serve more, and the receivables it can finance. Without all three, the number is an intention.
The starting point is history, and not the three-year average but month-by-month behavior, because seasonality rules. A company that sells evenly all year is budgeted differently from one that books 40 % of its sales in two months. It also pays to separate volume from price: if last year's growth came from a price increase, repeating that growth in volume is a different job.
Then come the limits. How many units can be produced or shipped per week, how many new customers the sales team can handle, how much receivables the company is willing to carry. Then the scenarios: a base case, a conservative one with lower sales and a demanding one. The base case is what gets approved, but the other two go to the monthly meeting, because the conservative case tells you how much room you have before you miss obligations.
Variable, fixed and step costs: where the budget breaks
Variable cost moves with sales and is therefore forgiven; fixed cost stays put and is what hurts when sales fall. The ratio between them defines how much the company can absorb: with a 38 % contribution margin, every peso of lost sales stops contributing 38 cents to the structure.
The real problem sits in the third type: step cost. It does not rise with each unit, but it jumps once a threshold is crossed. An extra shift, a second vehicle, a larger warehouse, a second person in billing. That step appears when sales grow and, if it was not planned, it gets financed out of the margin of the month it lands in. That is why the budget must answer an uncomfortable question: at what sales level do I need the next step, and what does it cost?
One effect is widely underestimated: when sales fall, fixed costs do not fall, and neither do the commitments already signed —rent, payroll, service contracts—. The structure has months of inertia, and that inertia is what turns one bad quarter into a cash problem.
Purchases and inventory budget
Buying is not spending. A purchase moves cash and inventory; the expense appears when the goods are sold. Confusing the two is why many companies look profitable on the income statement and are drowning at the bank.
Using this article's example, variable cost for the year is $744.000.000, that is $62.000.000 a month. If the company wants 60 days of inventory, it must finance $122.300.000 on average (744.000.000 ÷ 365 × 60). If it turns inventory six times a year, average inventory drops to $124.000.000; at four turns it rises to $186.000.000. The difference between four turns and six turns is $62.000.000 of capital freed or frozen without touching a single sale.
The purchases budget uses three inputs: budgeted consumption, desired ending inventory and beginning inventory. Purchases = consumption + ending inventory − beginning inventory. If goods are imported, add transit time and the supplier's minimum order, because what you order today arrives in two or three months.
Staff costs and their knock-on effect
Payroll is the line that grows most by inertia and the one most underestimated when budgeting. The base salary is not the cost: social security, payroll contributions where they apply, the statutory bonus, severance, severance interest and vacation accrue on top of it. The total load usually lands between 40 % and 55 % of base salary, depending on contract type and the company's exemptions; calculate it from the actual payroll, not from memory.
The knock-on effect goes beyond that load. A new hire brings a laptop, a desk and training, and often forces another expense up: calls, travel, supervision hours. If the role is commercial, it also brings commissions that grow with sales and belong in variable cost, not in fixed cost.
The budget forces one decision: hire before growth or after it. Hiring early costs margin for a few months; hiring late costs unserved sales and team burnout. What matters is that the decision is written down, with the month it is taken and the full monthly cost of the role, not just the salary.
The example: from sales to operating profit
So the exercise can be replicated, here are the full assumptions. They are exercise values, not market figures: sales of $1.200.000.000 a year, variable cost at 62 %, fixed expenses of $340.000.000, an equipment investment of $60.000.000 in March, collection at 30 days and supplier payment at 30 days.
| Assumption | Value | How it is used |
|---|---|---|
| Annual sales | $1.200.000.000 | $100.000.000 a month, no seasonality |
| Variable cost | 62 % of sales | $744.000.000 a year, $62.000.000 a month |
| Contribution margin | 38 % | $456.000.000 a year |
| Fixed expenses | $340.000.000 | $28.333.333 a month |
| Equipment investment | $60.000.000 | Leaves cash in March, is not a monthly expense |
| Customer collection | 30 days | What is sold one month is collected the next |
| Supplier payment | 30 days | What is bought one month is paid the next |
With those figures, annual contribution margin is $1.200.000.000 × 38 % = $456.000.000. Subtract fixed expenses and you are left with $116.000.000 of operating profit, 9.7 % of sales. A normal month looks like this: $100.000.000 in sales, minus $62.000.000 of variable cost, minus $28.333.333 of fixed expenses, equals $9.666.667.
That 9.7 % is the most important number in the exercise, because it sets the size of the error the company can absorb. A 10 % sales gap is not offset by cutting office supplies: it takes almost the whole margin. The next table shows the full year and the first quarter, first as budgeted and then as it came out.
| Item | Budgeted year | Budgeted quarter | Actual quarter | Variance |
|---|---|---|---|---|
| Sales | $1.200.000.000 | $300.000.000 | $276.000.000 | −$24.000.000 |
| Variable cost (62 %) | $744.000.000 | $186.000.000 | $171.120.000 | −$14.880.000 |
| Contribution margin | $456.000.000 | $114.000.000 | $104.880.000 | −$9.120.000 |
| Fixed expenses | $340.000.000 | $85.000.000 | $85.000.000 | $0 |
| Operating profit | $116.000.000 | $29.000.000 | $19.880.000 | −$9.120.000 |
| Operating margin | 9.7 % | 9.7 % | 7.2 % | −2.5 points |
| Equipment investment | $60.000.000 | $60.000.000 | $60.000.000 | $0 |
| Cash generated | $56.000.000 | −$31.000.000 | −$37.080.000 | −$6.080.000 |
Budgeted cash flow: the proof the plan is financeable
This is where half of all budgets collapse. The year can show a profit and the company still cannot make the March payroll. With collection and payment at 30 days, cash for a normal month is: prior month's collection $100.000.000, minus supplier payments $62.000.000, minus fixed expenses $28.333.333, equals $9.666.667.
March carries the investment: $100.000.000 − $62.000.000 − $28.333.333 − $60.000.000 = −$50.333.333. The month closes in the red and cumulative cash generated reaches −$31.000.000 at the end of March, after two positive months. The company is back above zero in July and ends the year with $56.000.000 of cash generated.
Notice the gap against profit: $116.000.000 of profit versus $56.000.000 of cash. The $60.000.000 difference is exactly the equipment. Buying an asset is not an expense of the month, but it is a cash outflow of the month, and that asymmetry is what breaks profitable companies. If receivables stretch as well, the hole grows: at year end $100.000.000 sits uncollected and $62.000.000 is owed to suppliers, which is the underlying reason cash never matches profit.
Out of this comes the figure that belongs in front of the board: the peak funding need. In this example it is $31.000.000 during the first half, plus a buffer for surprises. That number is arranged before it is needed, not on the day it is missing.
Monthly follow-up: variance, cause and action
The budget starts working when it is compared. Each month you take actual against budgeted, line by line, and calculate three things: the variance in pesos, the variance in percentage and the effect on profit. Then you answer one question per variance: was it volume, price, mix or cost?
In the example, the quarter sold $276.000.000 instead of $300.000.000, 8 % less. With variable cost at 62 %, margin fell $24.000.000 × 38 % = $9.120.000, and since fixed expenses did not come down, quarterly profit went from $29.000.000 to $19.880.000. The drop in profit equals the drop in margin: when fixed costs do not move, the whole hit lands on the result.
The work does not end there. A variance without a cause is data, not a decision. The cause is written in one concrete sentence —we lost customer X in February, price went up and volume fell, waste grew after the supplier change— and every cause carries an action with an owner and a date. If the variance will repeat, the action fixes the operation; if it was one-off, the action fixes next month's assumption.
Zero-based and incremental budgeting: when to use each
Incremental takes last year and adds or subtracts a percentage. It is fast and works when the operation is stable and expenses repeat almost unchanged. Its risk is obvious: it carries last year's mistakes forward forever, because nobody asks why a line exists.
Zero-based builds every line from the objective, as if the expense had never existed. It costs more time and more argument, and it pays off when real cuts are needed, when the company changed size or model, or when an area has been growing for years without explanation.
In practice they are combined: zero-based for the areas in doubt —advertising, travel, professional fees, services— and incremental for those with stable, contractual behavior, such as rent, insurance and licenses. What you cannot do is apply incremental to everything and call it a budget.
The calendar matters: when it is built and who signs it
A budget built in the last week of December comes out with last year's assumptions and no time to argue about them. Serious work starts in October: sales assumptions first, then purchases and expenses in November, and in the first half of December cash is consolidated and the plan is approved.
Who signs also matters. If one person approves it without the areas having discussed it, every variance will have a different culprit and no solution. Approval should leave three things in writing: the approved scenario, the variance tolerated without explanation, and the date of the monthly meeting.
Common mistakes: symptom, consequence and fix
Almost every budget that fails fails for the same six reasons. The table sums them up with the symptom you see in the meeting and the concrete fix, not good intentions.
| Mistake | Symptom | Consequence | Fix |
|---|---|---|---|
| Budgeting sales with no history or capacity | The target rises every year and is never met | Purchases and staff sized too large | Project from units and capacity, with a conservative scenario |
| Ignoring the lag between collection and payment | Positive profit, red cash | Funded with expensive debt or late payroll | Monthly cash budget, not annual |
| Booking equipment as a monthly expense | The purchase month loses and the rest gain | Decisions taken on a distorted result | Separate investment from expense and depreciate the asset |
| No owner for each line | Nobody explains the variance | The budget adjusts itself at year end | A name and a role on every block |
| Comparing without explaining the cause | The meeting is a list of numbers | The symptom is fixed, not the origin | One cause and one action per variance |
| Rebuilding the budget so it balances | The budget changes every month | The benchmark and the comparison are lost | Freeze the budget and run a separate forecast |
An honest close before you decide
Budget and forecast are not the same thing, and confusing them ruins control. The budget is the commitment approved in December and left alone: it is the yardstick. The forecast is the best estimate of where the year will end with what is known today, and it is updated monthly. When the forecast drifts from the budget, the conversation is not about changing the budget but about deciding what to do with the difference.
None of this replaces your accountant. A budget is a management tool, not a financial statement, and its figures are assumptions corrected along the way. If the company is very small, with tight cash and irregular sales, a full annual budget may be too much: start with the weekly cash flow and the contribution margin, and add the rest when the business asks for it.
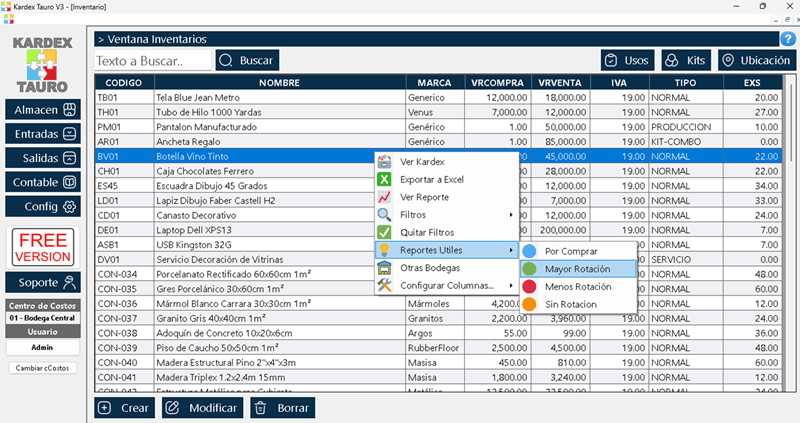
It does not work either if management does not use it. A budget with no monthly meeting, no written cause and no action with a date is decoration. If you are going to spend the time building it, spend the meeting too. Tools such as Kardex Tauro help keep actual sales, inventory and receivables figures available on time, which is the condition for a monthly comparison to exist at all.