Activity-based costing: what it is and when it pays off
Activity-based costing: what it is and when it pays off
When a company's overhead is significant and it is spread by labor hours, simple high-volume products end up paying for everyone else's complexity. Activity-based costing fixes that allocation: it assigns overhead to the activities that actually consume it and from there to products, using cost drivers that measure real consumption. Here is how it works, the five steps to implement it, a worked example with three activities and two products, and the point almost nobody discusses: when it is not worth the effort.
ABC is not an academic fad, and it does not replace accounting. It is a cost management model fed by accounting, and it exists to decide prices, product mix, minimum order size and processes. It is also, in many small and mid-sized companies, the tool most often abandoned: it is implemented with enthusiasm and left to die when it starts demanding data nobody is measuring. Both sides matter when deciding whether to go ahead.
The real problem: when the average lies
Traditional costing spreads manufacturing overhead, known in Colombian accounting as CIF, using a single base: labor hours, machine hours or units produced. It works while products look alike. It stops working when the company makes items that differ widely in volume and complexity, because a single average treats a batch of a thousand units the same as a batch of twenty.
The assumption behind it is simple: the product that consumes the most labor hours is the one that consumes the most overhead resources. When most overhead comes from setups, order handling, inspections or shipping, that assumption breaks. The high-volume product pays part of the cost generated by the low-volume one, and the low-volume item shows up in the system as more profitable than it really is.
The symptoms in the income statement are recognizable: margins that do not match commercial intuition, large customers who buy a lot and leave little, niche items the system reports as highly profitable. No single symptom proves that ABC is needed, but together they justify reviewing how overhead is being allocated before making any pricing decision.
Activities, drivers and pools: the minimum vocabulary
ABC changes the question. Instead of asking how many hours a product consumed, it asks which activities it consumed and in what quantity. Four words explain the whole model.
- Activity: the task that consumes resources. Setting up a machine, processing a customer order, inspecting a batch, shipping an order.
- Pool (cost pool): where the overhead of one activity is accumulated. One pool per activity, not one pool per cost center.
- Cost driver: the measure of that activity's real consumption. Number of machine setups, number of orders, number of inspections, kilometers, design hours, number of invoices.
- Rate: the pool cost divided by the total quantity of the driver. This is what gets multiplied by each product's consumption.
The driver is the most delicate decision in the whole model. It must explain consumption, not just be easy to count. A convenient driver that does not move when complexity changes produces a number that looks like ABC but is not. If two activities share the same driver and the same behavior, they can be merged without losing anything.
The five steps, in order
- Identify the activities that consume overhead resources. You do not list the company's full processes: you list the tasks that explain the cost. If a task does not move money, it stays out.
- Group overhead by activity, creating one pool per activity. The pools must add up to the period's total overhead. If they do not, some cost is unassigned or assigned twice.
- Choose the driver for each pool, using the measure that best explains why that activity consumes resources.
- Calculate the rate by dividing the pool cost by the total quantity of the driver in the same period.
- Assign to products by multiplying each one's consumption by the rate of each activity, then adding the results.
Step two is the model's quality control, and it is almost always skipped. An ABC that does not reconcile to total overhead can still produce handsome tables, but it cannot be used to decide: any price gap it shows may be caused by whatever was left out.
A worked example with three activities and two products
The figures below are a textbook exercise with round numbers, not market data. A plant has monthly overhead of $12,000,000 (Colombian pesos) split across three activities: machine setup, order handling and inspection.
| Activity | Monthly overhead (COP) | Driver | Quantity for the month | Rate |
|---|---|---|---|---|
| Machine setup | $3,600,000 | Setups | 120 | $30,000 per setup |
| Order handling | $4,800,000 | Orders | 400 | $12,000 per order |
| Inspection | $3,600,000 | Inspections | 600 | $6,000 per inspection |
| Total | $12,000,000 |
Each rate is one division: $3,600,000 divided by 120 setups gives $30,000 per setup; $4,800,000 divided by 400 orders gives $12,000 per order; $3,600,000 divided by 600 inspections gives $6,000 per inspection. The three rates are different, and that is the point: each activity has its own unit of consumption. Spreading everything by labor hours forces you to average three behaviors that have nothing to do with each other.
Now each product's consumption for the month. Product A is low volume and high complexity: 2 setups, 20 orders, 40 inspections. Product B is high volume with little variation: 1 setup, 5 orders, 10 inspections.
| Item | Product A | Product B |
|---|---|---|
| Setups consumed | 2 | 1 |
| Setup cost | 2 x $30,000 = $60,000 | 1 x $30,000 = $30,000 |
| Orders consumed | 20 | 5 |
| Order handling cost | 20 x $12,000 = $240,000 | 5 x $12,000 = $60,000 |
| Inspections consumed | 40 | 10 |
| Inspection cost | 40 x $6,000 = $240,000 | 10 x $6,000 = $60,000 |
| Overhead assigned | $540,000 | $150,000 |
Product A adds up to $60,000 plus $240,000 plus $240,000, which is $540,000. Product B adds up to $30,000 plus $60,000 plus $60,000, which is $150,000. Note the proportion: A consumes one fifth of B's orders, yet its overhead is almost four times larger. That difference does not come from volume, it comes from complexity.
The same month under the traditional method
With a single labor-hour base and 1,200 hours in the month, the rate is $12,000,000 divided by 1,200 hours, which is $10,000 per hour. If batch A consumes 30 hours, it is charged $300,000. If batch B consumes 90 hours, it is charged $900,000. The allocation comes out inverted compared with ABC.
| Item | Batch A | Batch B |
|---|---|---|
| Units in the batch | 100 | 1,000 |
| Labor hours | 30 | 90 |
| Overhead with a single base | $300,000 | $900,000 |
| Overhead with ABC | $540,000 | $150,000 |
| Difference | $240,000 more under ABC | $750,000 less under ABC |
| Overhead per unit, single base | $3,000 | $900 |
| Overhead per unit, ABC | $5,400 | $150 |
The high-volume product looked expensive and was not that expensive; the low-volume one looked cheap and was not. Product A's overhead per unit goes from $3,000 to $5,400, and B's falls from $900 to $150. If the price was set with traditional cost, A was sold below its real cost and B with a margin that does not exist. The conclusion is not that ABC is right by definition: it is that the earlier allocation was hiding a difference of $2,400 per unit on one product and $750 on the other.
The small order that looks profitable
ABC's logic is counterintuitive until you look at the detail: a small order consumes almost as much handling as a large one. It has its own purchase order, its setup, its inspection, its invoice, its shipment and its collection. Overhead does not grow with units, it grows with events.
That is why ABC usually moves the discussion from price toward minimum order size and commercial policy. A customer who buys twenty times a year in small quantities may consume more handling than one who buys twice in volume. If the margin does not pay for that handling, the company is financing that customer's convenience without knowing it.
This does not mean charging more for every small order. It means knowing what it costs to serve one and deciding with the number: a setup fee, a minimum purchase, a surcharge for rush orders or, simply, no longer chasing that segment. Any of those four decisions beats continuing to sell on a margin calculated from a cost that is not the real one.
How many activities are enough
ABC's risk is not a lack of detail: it is excess. Every new activity demands a driver, and every driver demands measuring something every month. When the model reaches two hundred activities, the team spends more time feeding it than using it, and within a year it is abandoned. That is the most repeated failure pattern.
The practical rule seen in implementations that survive: fifteen or twenty well-chosen drivers deliver about eighty percent of the model's value. The rest is precision that changes no decision. The exact number depends on the sector and the size of the company, so treat it as a reference rather than a target.
Three criteria decide whether an activity belongs. Its cost must be material within total overhead. Its consumption must vary in a real way across products, customers or orders. And its driver must be measurable with data that already exists or that can be captured without extra work. If any of the three fails, the activity stays out and its cost is spread with a simple criterion.
The data you have to start measuring
ABC does not fail because of the math, it fails because of the data. Before calculating the first rate, review what can be measured today and what would have to start being recorded next month.
- Time per activity: how long a setup, an inspection, a machine changeover takes.
- Number of orders per product and per customer, not just the amount invoiced.
- Number of machine setups per item and per batch.
- Number of inspections, invoices and shipments issued.
- Kilometers or number of deliveries, if distribution weighs on overhead.
Almost all of this can be captured in the inventory and billing system if documents are recorded with enough detail: an order is a document, a setup is a production event, an inspection leaves a record. If those events are not recorded today, the first month of ABC will be an estimate, and the report should say so instead of presenting it as an exact figure.
How to use the result to decide
A cost model that only informs ends up as a report nobody reads. ABC is useful when it changes at least one of four decisions.
Prices. If a product was undercosted, its current price may be below cost. Before raising it, review elasticity and competition: ABC tells you what it costs, not what the market will bear.
Product mix. Items that looked profitable may be carried by the ones that truly are. ABC shows which stand on their own and which live off the mix.
Minimum order size. This is the decision where the model pays for itself. If serving an order costs $12,000 in handling plus the setup, a low-value order rarely leaves a margin.
Processes. The one that leaves the most money and gets the least attention. If the cost sits in setup, cutting setup time lowers the cost of every product at once, without touching prices or customers.
Order matters. Changing processes is slower than changing prices, but it is also harder to copy and it does not expose the company to losing customers along the way.
When it pays off and when it is a luxury
ABC is justified when four conditions coincide: overhead carries significant weight in total cost, products differ widely in volume and complexity, margins cannot be explained with the information available, and small orders consume a lot of handling. If the first is missing, the model changes nothing. If the second is missing, the average works fine.
| Signal in your company | What it indicates | What to do |
|---|---|---|
| Overhead weighs more than direct labor | The labor-hour allocation lost its meaning | ABC with few activities |
| Items with very different volumes | The average mixes behaviors | Separate at least two product groups |
| Margins that defy intuition | Some cost is misallocated somewhere | Review drivers before touching prices |
| Many small orders | Handling is the real cost, not units | Measure orders, setups and inspections |
| A single product or low overhead | There is no mix to distort | Simple costing, no ABC project |
| Small company with no time data | Measuring costs more than the benefit | Record first, model later |
There is an economic limit worth saying out loud: if the cost of measuring the drivers exceeds the benefit of the precision, the model does not pay for itself. That calculation is almost never made, and it is why many implementations die with every activity well defined and nobody updating them.
Why implementations fail
The recurring mistakes are not technical, they are about scope and expectations. These are the five most common, with the symptom you see and the consequence they leave.
- Too many activities. The model takes two weeks to close the month and nobody finishes it. It is abandoned within the first year.
- Drivers that are easy to count and poor at explaining. Allocated cost does not move when complexity changes. Decisions are made on a number that looks like ABC but is not.
- Promising it replaces accounting. Arguments break out over figures that do not reconcile to the balance sheet. The accounting team defends the official number and the model is left without an owner.
- Starting with the whole company. Six months of mapping without a single decision made. Management's sponsorship runs out before the first result.
- No assigned owner. Nobody updates the rates or reviews the drivers. The model keeps showing last year's data and loses credibility.
ABC is a cost management model: it is fed by accounting and does not replace it. And like any management model, it needs someone who uses it every month, not someone who admires it on presentation day.
An honest closing before you start
ABC is not for every company and it does not fix a pricing problem on its own. If your case is a single product, low overhead or a structure where labor is still the dominant resource, the effort of measuring drivers will not pay off. Nor does it replace your accountant: the model is fed by accounting and must reconcile with it, and pricing and product-mix decisions still need commercial judgment.
If you decide to move forward, start small: two or three activities, one product or one family, one month of data. Check that the pools add up to total overhead. Compare the assigned cost with the one you already use and ask whether the difference changes any concrete decision. If it does not, do not expand the model. If it does, you now have the argument to expand it with data rather than enthusiasm.
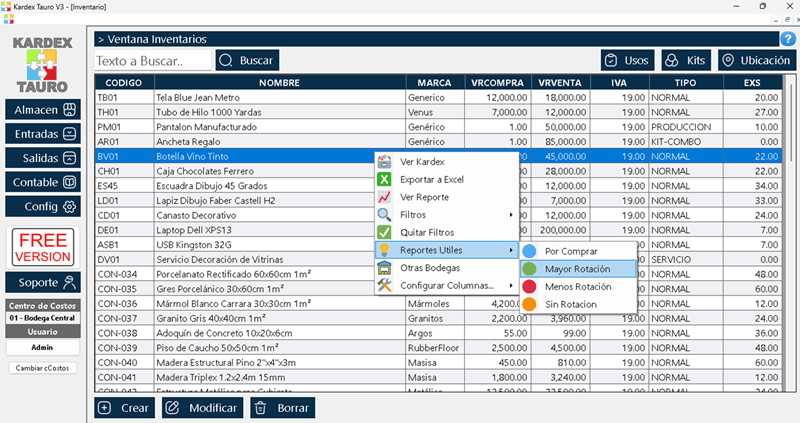
When orders, setups and shipments are recorded in the same system that holds inventory and billing, the model is fed by daily operations instead of a separate project. Kardex Tauro is used in that setting: the data ABC needs is already written down when the work is done.