Working capital: what it is, how to calculate it and how to manage it
Working capital: what it is, how to calculate it and how to manage it
Working capital is the money a business has tied up in its operation, and it grows exactly when the business grows. It is calculated as current assets minus current liabilities, but that subtraction on its own says nothing about how much financing the company needs: for that you have to look at inventory days, receivable days and payable days. Here are both formulas, the cash conversion cycle with a full example, the real effect of growing 20 % and the four levers that release cash without borrowing a single peso.
What working capital is and what it is not
Working capital is the cushion a company uses to cover its short-term obligations. It is obtained by subtracting current liabilities from current assets. If the result is positive, the operation has what it needs to meet what falls due in the next twelve months; if it is negative, the company depends on renewing debt or on suppliers continuing to finance it.
It is not profit. Profit lives in the income statement and is recognised when the invoice is issued; working capital lives in the balance sheet and is paid with cash. A company can close the year with record profit and run out of money for January payroll, because it sold on credit and inventory grew faster than collections.
Nor is it liquidity. A comfortable current ratio can hide a company with no cash: if 90 % of current assets sits in inventory and receivables and only a small fraction in cash, the ratio looks fine and the bank account does not. Liquidity is measured by the cash on hand and how easily it can be converted; working capital measures how much is held back inside the operation.
The idea that organises everything else is this: working capital is not a balance you review in December, it is a need that moves with sales. Every additional peso of sales demands inventory and receivables before it returns any cash.
The balance sheet formula and the operating formula
Working capital = current assets − current liabilities. Current assets include cash, short-term investments, accounts receivable and inventory. Current liabilities include suppliers, payroll obligations, taxes payable and the current portion of financial debt. This is the accounting definition and it is used to read the balance sheet.
Operating working capital = inventory + accounts receivable − suppliers. It leaves out cash and financial debt. It answers a different question: how much money the operation has tied up, regardless of how it was financed. This is the figure you project against sales, and the one that explains why growth costs cash.
The two figures do not match, and they do not have to. In the example in this article the first gives $57,000,000 and the second $69,000,000. The difference is the $8,000,000 in cash and the $20,000,000 in short-term obligations that one includes and the other does not.
It is worth calculating both. The first tells you whether the company can pay what falls due; the second tells you how much new financing it needs if sales rise. A comfortable balance-sheet working capital can coexist with an operation that runs out of cash as it grows.
The three day counts that explain the whole cycle
The cash conversion cycle measures how long passes between paying and collecting. It is built from three periods, all in days and all based on a 365-day year:
- Inventory days (DIO) = inventory / cost of sales × 365. How long goods sit before they are sold.
- Receivable days (DSO) = receivables / sales × 365. How long the customer takes to pay.
- Payable days (DPO) = suppliers / purchases × 365. How much time the supplier grants.
Cash conversion cycle = DIO + DSO − DPO. If the result is positive, the operation consumes cash: the company pays before it collects and funds the gap with its own resources or with debt. If it is negative, the operation finances growth: it collects before it pays.
Every day of cycle has a price. In the example that follows, one day equals roughly $1,500,000 tied up. Ten days is not a cosmetic improvement: it is fifteen million returning to the bank account.
A worked example with a balance sheet: from $57,000,000 to 45.6 days
The figures are exercise figures, not market data, and they exist so the calculation can be replicated. The company sells $540,000,000 a year, its cost of sales is $480,000,000 and it purchases $432,000,000. The short-term balance sheet looks like this:
| Account | Amount | Classification |
|---|---|---|
| Inventory | $60,000,000 | Current assets |
| Accounts receivable | $45,000,000 | Current assets |
| Cash | $8,000,000 | Current assets |
| Total current assets | $113,000,000 | |
| Suppliers | $36,000,000 | Current liabilities |
| Short-term obligations | $20,000,000 | Current liabilities |
| Total current liabilities | $56,000,000 |
Working capital = (60 + 45 + 8) − (36 + 20) = 113 − 56 = $57,000,000.
Operating working capital = (60 + 45) − 36 = $69,000,000.
The first number says the company covers its short-term obligations with a $57,000,000 cushion. The second says it has $69,000,000 tied up in goods and receivables, and that suppliers finance $36,000,000 of that total. The $12,000,000 gap between the two explains why you should never decide on just one of them.
The full cycle: 45.6 days of cash tied up
With those same balances and the sales, cost and purchase data, the cycle is calculated like this:
| Indicator | Formula | Calculation | Result |
|---|---|---|---|
| Inventory days | Inventory / cost of sales × 365 | 60 / 480 × 365 | 45.6 days |
| Receivable days | Receivables / sales × 365 | 45 / 540 × 365 | 30.4 days |
| Payable days | Suppliers / purchases × 365 | 36 / 432 × 365 | 30.4 days |
| Conversion cycle | DIO + DSO − DPO | 45.6 + 30.4 − 30.4 | 45.6 days |
The cycle is positive. The company pays at 30.4 days, collects at 30.4 days, and inventory stays 45.6 days in the warehouse. Because collection and payment terms match, the cycle ends up equal to inventory days. That coincidence is not a rule of business; it is what happens in this particular balance sheet.
Read the result in days, not only in pesos: the operation takes 45.6 days to turn a purchase into collected cash. During those 45.6 days someone has to put up the money, and that someone is the company.
Why growing 20 % consumes $13,800,000 in cash
Suppose sales rise 20 % and the company keeps the same inventory, collection and payment days. This is neither an optimistic nor a pessimistic assumption: it is how you isolate the effect of volume.
Inventory: 60 × 1.20 = $72,000,000. Receivables: 45 × 1.20 = $54,000,000. Suppliers: 36 × 1.20 = $43,200,000. Operating working capital = 72 + 54 − 43.2 = $82,800,000.
Operating working capital goes from $69,000,000 to $82,800,000. The difference, $13,800,000, is cash that must be put in before a single extra peso of profit arrives. The extra sale is invoiced, the profit is accrued, and the money goes into inventory and receivables.
The company in the example holds $8,000,000 in cash. To grow 20 % it needs $13,800,000. It is $5,800,000 short. If it raises that with a short-term obligation, current liabilities rise to $77,000,000 and balance-sheet working capital stays at $57,000,000, exactly as before. The figure people usually watch did not move. What did change: the current ratio fell from 2.0 to 1.7, and there are now $13,800,000 falling due in under a year against inventory that takes 45.6 days to turn into cash.
And if growth arrives with longer collection terms, which is normal when you push sales, the need rises above $13,800,000. The calculation with constant days is the floor, not the ceiling.
How to finance it without choking the operation
There are four sources: cash generated by the operation, supplier terms, short-term debt and equity. None is good or bad on its own; what sinks companies is the matching between source and use.
Generated cash is the only free source, and it is the first to run dry when you grow fast: profit comes in, but it comes in as receivables. Supplier credit is cheap financing when it costs nothing; when a supplier offers an early-payment discount, the term has a price that must be calculated before giving it up.
Short-term debt covers peaks, not structure. Financing growth with short-term debt is the most common cause of insolvency in small and medium businesses: inventory takes 45.6 days to become cash, the obligation matures in 30 or 90, and renewal depends on a bank that can say no exactly when you need it most. Equity, by contrast, is the most expensive and the most patient source; it is meant for permanent working capital, the part that does not fall even when sales drop.
The practical rule: structural working capital is financed with long-term resources or equity; the seasonal peak, with short-term lines that are repaid when the peak passes. When it is done the other way round, the company refinances every quarter and loses negotiating power with both the bank and its suppliers.
The four levers and their measurable effect
You do not need new financing to close the growth gap. These four levers attack the cycle directly, and their effect can be calculated on the same balance sheet:
| Lever | What is done | Effect on the cycle | Requirement |
|---|---|---|---|
| Inventory | Prune slow-moving items and review reorder points | 10 fewer days release $13,200,000 | Do not lower service levels |
| Receivables | Invoice the same day, request deposits, track every due date | 10 fewer days release $14,800,000 | Written policy, actually applied |
| Suppliers | Negotiate longer terms in exchange for volume or scheduled payment | 10 more days release $11,800,000 | Do not lose discounts or trust |
| Production | Smaller batches and less work in progress | Reduces inventory days | Sustained capacity and quality |
The first three, applied together, cut the cycle from 45.6 to 15.6 days and release close to $39,800,000: $13,200,000 from inventory, $14,800,000 from receivables and $11,800,000 from suppliers. For a business that needs $13,800,000 to grow 20 %, that is the difference between borrowing and self-financing.
Order matters. Inventory is released first because it does not depend on third parties; receivables depend on collection discipline; supplier terms are the last to give and the hardest to recover if the relationship breaks.
Negative working capital: when it is efficient and when it is a warning
A negative cycle is not a calculation error. A supermarket collects cash and pays at 60 days: the customer finances the operation, inventory turns fast and cash is plentiful. That is efficiency, not a problem.
The same number can mean the opposite: a company that stopped paying suppliers because it has nothing to pay with. The balance sheet does not tell the two apart. To know which one you are looking at, examine the detail:
- If payable days jumped suddenly and overdue invoices grew, it is non-payment, not negotiation.
- If early-payment discounts are being lost or suppliers have cut the credit limit, the term has become an imposition.
- If the negative cycle comes with fast-turning inventory and customers paying cash, it is a business model, not a symptom.
- If the negative appears only in the consolidated figures and not in the operation, it may be an effect of non-operating items.
The quick test: negative working capital with ample cash and suppliers paid on time is efficiency. With tight cash and overdue invoices it is a warning that is already materialising.
How to project it month by month
An annual calculation is no use for deciding in March. Working capital is measured by periods and projected against next period's sales, in this order:
- Calculate daily sales and daily cost of sales for the projected month. Work in days, not closed months.
- Take inventory, receivable and payable days from the last three to six months. A single month lies because of seasonality.
- Apply those days to projected sales to obtain the month's operating working capital.
- Subtract available cash and credit lines already approved. What remains is the net need.
- Compare that need with projected cash, not with today's cash. If the lowest point falls below the month's payroll and taxes, there is a structural problem.
- Set a trigger: if receivable days pass a certain level, stop granting credit; if inventory passes a certain number of days, stop buying.
The projection has to be monthly because working capital is seasonal: it rises before the high season, falls afterwards, and the annual average hides both extremes.
The mistakes that cost the most
| Mistake | How it shows up in practice | What it costs |
|---|---|---|
| Watching only the current ratio | Stable indicator while cash runs out | Discovered late, with payroll at risk |
| Calculating once a year | December figure used to decide in March | Decisions made on another quarter's data |
| Projecting without sales | Need calculated on the current size | The growth requirement is underestimated |
| Financing growth with short debt | Refinancing every quarter and rising collateral | The most common cause of insolvency in SMEs |
| Cutting inventory without measuring service | Stockouts and lost sales | The cash released is lost in sales |
| Granting credit with no policy | Receivable days rising month after month | Working capital turns into overdue receivables |
| Confusing cash balance with working capital | High cash right after a drawdown | Debt is used as if it were profit |
The common pattern: the balance is measured and the flow is not. Working capital is not fixed with a snapshot of the balance sheet; it is fixed by moving days.
An honest closing before you decide
What this calculation does not solve: it does not replace the accountant or a review of the financial statements. Working capital calculated on a balance sheet with misvalued inventory, or with receivables that will never be collected, gives a reassuring and false figure.
Nor are there universal values for the days. A food distributor and a furniture manufacturer share neither inventory nor terms. Benchmarks are useful within the same sector and the same size; comparing yourself with the average of the whole economy says nothing.
If your company is seasonal, bills by project, or has just opened a new line, the monthly average hides the peaks and the projection has to be weekly in the critical months. And if operating working capital grows faster than profit for two or three periods in a row, the conversation is no longer about an indicator: it is about how growth is being financed.
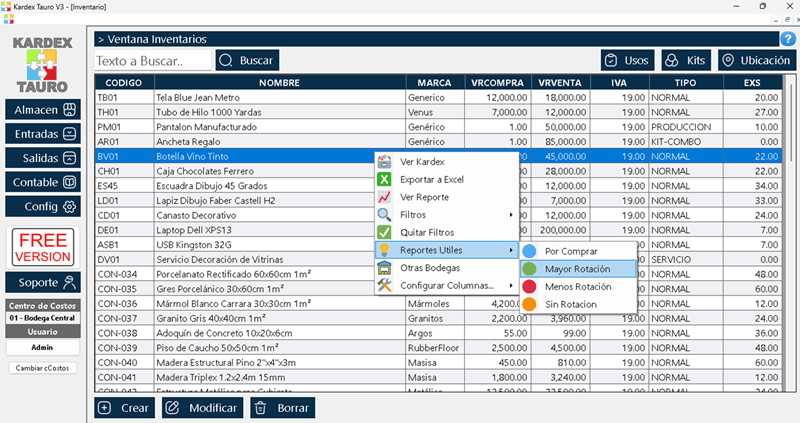
If you need to see inventory and receivable balances by period without rebuilding the spreadsheet every month, inventory and invoicing software such as Kardex Tauro keeps those figures current; what to do with them remains your decision and your accountant's.