Financial ratios: which ones matter and how to read them

Financial ratios: which ones matter and how to read them
The month-end report arrives with a table of figures and a question almost nobody answers: if the current ratio is 1.50, is that good? A single ratio is neither good nor bad; it is a number without context. It becomes information when it is compared with the previous period, with the industry and with the target the company set for itself. This article lays out the ratios that are actually used, the formula for each one, a full example with nine of them worked out step by step, and the points where they get misread. The figures in the example are a textbook exercise, not market data.
The four groups and the question each one answers
Every financial ratio comes from three statements: the balance sheet, the income statement and, when cash is what matters, the cash flow statement. Those sources feed four groups. Each group answers a different question and none replaces the others. A company can have liquidity to spare and still not be profitable; it can be profitable and run out of cash on a Friday. Looking at one group alone is looking at one side of the business.
| Group | Question it answers | Ratios |
|---|---|---|
| Liquidity | Is there enough to pay what comes due in the short term? | Current ratio, quick ratio |
| Leverage | How much of the business is funded with debt? | Liabilities over assets, debt-to-equity |
| Efficiency | How long does the money take to come back? | Receivables turnover, inventory turnover |
| Profitability | How much is left per peso sold and per peso invested? | Gross margin, net margin, ROA, ROE |
Liquidity: the question is whether Monday gets paid, not whether the number is 1.5
The current ratio divides current assets by current liabilities. It says how many pesos of short-term assets stand behind each peso of debt due in the same window. The quick ratio runs the same calculation but subtracts inventory, because inventory does not turn into money at the speed of a collected invoice.
That is the first trap. A retailer whose inventory turns in 30 days can live with a quick ratio of 0.75, because it sells fast. A manufacturer whose raw material takes months to become a finished product has the same 0.75 and a serious problem. The number is identical; the reality is not.
The second trap is what sits inside current liabilities. Short-term bank debt, suppliers, taxes and payroll all live there. If liabilities are concentrated in facilities the bank renews every year, the company depends on that renewal. None of it shows up in the current ratio: it shows up in the notes to the balance sheet and in the maturity schedule.
Leverage: how much of the business belongs to someone else
Leverage as a share of assets divides total liabilities by total assets. It is the percentage of the resources the company uses that do not belong to the owners. Debt-to-equity compares liabilities with equity: how many pesos of debt there are for every peso of the owners' money.
Neither has a universal ceiling. A service company with stable revenue carries more debt than one that depends on two customers. What matters is the combination: high debt with a thin net margin leaves little room for a bad quarter; high debt with solid margins and long maturities is a business decision, not a mistake.
Currency and tenor matter too. Debt in dollars against revenue in pesos gets expensive when the dollar rises, and that effect is not in the ratio: it is in next period's financial expense.
Efficiency: how many days it takes for the money to come back
Receivables turnover divides sales by receivables. The result says how many times a year the entire receivables balance is collected. Dividing 365 by that turnover makes it readable: days to collect. The same logic applies to inventory turnover, which divides cost of goods sold by inventory; 365 divided by the result gives the days inventory sits in the warehouse.
Two warnings. First: numerator and denominator must be comparable. If sales include Colombian VAT and receivables include it too, the calculation works; if one carries VAT and the other does not, the result is inflated or penalised and nobody notices. The same goes for cost of goods sold and inventory: both are stated without VAT. Second: use 365 days across the whole dashboard, or 360, but never both, because the same fact ends up with two different figures depending on who runs the numbers.
These two ratios explain a cash problem faster than any other pair. A profitable company that moves from 30 to 60 days to collect needs twice the capital to sell the same volume, and that capital comes from somewhere: cash or the bank.
Profitability: four margins that do not say the same thing
Gross margin divides gross profit by sales and measures what is left after the cost of the product. Net margin divides net profit by sales and measures what is left after everything: expenses, interest and taxes. The difference between the two is, in practice, everything the company spends to sell and to administer itself.
ROA divides net profit by total assets: how much each peso invested in the business generates, regardless of how it was funded. ROE divides net profit by equity: how much each peso of the owners' money generates. ROE will exceed ROA whenever there is debt, because the denominator is smaller. That is not better management: it is more risk.
That is why ROE is read next to leverage. An ROE of 18 % with leverage at 50 % is healthy. The same 18 % with leverage at 80 % holds while the business holds, and turns into a loss the moment the margin gives up a couple of points.
EBITDA: it measures the operation, not the cash
EBITDA adds operating profit, depreciation and amortisation. Its value is that it compares the operation across companies with different debt and tax burdens, and across periods where investment in assets changed. That is exactly what it measures: the cash the operation generates before taxes, interest and capital.
What it does not measure matters just as much. It is not cash flow: it does not deduct what was spent on machinery, nor what got stuck in receivables and inventory, nor taxes paid. A company with positive EBITDA can come up short for Friday's payroll. EBITDA cannot tell you whether the company can pay a debt tomorrow.
It answers a different question: does the operation, in itself, produce more than it costs to run? If the answer is no, no financial adjustment fixes it. If the answer is yes and cash is still short, the problem sits in working capital or in investment, not in the operating margin.
A full example: the nine ratios of one company
A trading company with these figures for the year: sales $600,000,000; cost of goods sold $420,000,000; gross profit $180,000,000; net profit $36,000,000; current assets $120,000,000; inventory $60,000,000; current liabilities $80,000,000; total liabilities $200,000,000; total assets $400,000,000; equity $200,000,000; receivables $50,000,000. From those, the nine ratios.
| Ratio | Formula | Calculation | Result | What it says |
|---|---|---|---|---|
| Current ratio | Current assets / current liabilities | 120 / 80 | 1.50 | For every peso coming due there is 1.50 of backing |
| Quick ratio | (Current assets − inventory) / current liabilities | 60 / 80 | 0.75 | Without inventory, the backing does not cover what is due |
| Leverage | Total liabilities / total assets | 200 / 400 | 50 % | Half of the assets are funded by third parties |
| Receivables turnover | Sales / receivables | 600 / 50 | 12 times (30 days) | Receivables are collected once a month |
| Inventory turnover | Cost of goods sold / inventory | 420 / 60 | 7 times (52 days) | Inventory sits almost two months in the warehouse |
| Gross margin | Gross profit / sales | 180 / 600 | 30 % | Of every $100 sold, $30 remain before expenses |
| Net margin | Net profit / sales | 36 / 600 | 6 % | Of every $100 sold, $6 remain at the end |
| ROA | Net profit / total assets | 36 / 400 | 9 % | Every $100 of assets generate $9 of profit |
| ROE | Net profit / equity | 36 / 200 | 18 % | Every $100 of the owners' money generates $18 |
Debt-to-equity, liabilities over equity, is 1.00: there is as much debt as owners' capital. Current liquidity looks comfortable at 1.50, but strip out inventory and it falls to 0.75, and that is the weak spot: the company depends on selling inventory to pay what comes due. And inventory takes 52 days to leave, longer than the 30 days receivables give it to collect. That is a 22-day gap the company funds out of its own pocket.
Profitability tells another story. A 30 % gross margin is reasonable for trading; the 6 % net margin leaves little cushion, because two of every three pesos of gross margin go to expenses, interest and taxes. The 18 % ROE doubles the 9 % ROA, and that gap does not come from selling better: it comes from half the assets being paid for with debt.
The same company a year earlier: it grew and earned less per peso sold
A year earlier, sales were 15 % lower: $522,000,000, because 600 divided by 1.15 gives 521.7. Net margin was 7 %. Those two data points rebuild the profit: 7 % of 522 is $36.5 million. This year profit is $36.0 million.
The company sold 15 % more and earned practically the same. Had it held the 7 % margin, profit would have been 600 times 7 %, that is $42.0 million. There are $6.0 million left on the table. It grew and earned less per peso sold.
| Item | Prior year | Current year | Change |
|---|---|---|---|
| Sales | $522.0 million | $600.0 million | +15 % |
| Net margin | 7 % | 6 % | −1 point |
| Net profit | $36.5 million | $36.0 million | −1.4 % |
| Profit at the prior margin | — | $42.0 million | $6.0 million not captured |
The cause can be any of several: discounts to grow, a sales mix that shifted toward lower-margin products, a cost of goods sold that rose faster than price, or fixed expenses that grew with the operation. The ratio does not say which. That is found in the income statement line by line and in the sales detail by product. What the ratio does say, clearly, is where to look.
Trend, industry and target: the three mandatory comparisons
Trend needs three periods at minimum, and five if the business is seasonal. One period is a photograph; a series is a film, and decisions are made with films. A margin falling three months in a row says something different from a margin that falls one month and recovers.
The industry puts the number on a scale. The same 6 % net margin can be acceptable in distribution and very low in services. To compare you need a source that uses the same definition of the ratio: trade associations, sector studies, financial databases, or the accountant who serves several companies in the same line. Comparing against an average without knowing how it was calculated is worse than not comparing at all, because it gives a false sense of reference.
The target is the one the company wrote down. Without a target, every positive ratio gets celebrated and every negative one gets explained away; with a target, the conversation is about the gap and about what closes it. And keep in mind that good values do not exist in the abstract: a current ratio of 1.2 can be healthy in trading and tight in manufacturing. It depends on the cash cycle, the debt maturity and the owners' backing.
How a closing snapshot gets dressed up
Ratios are calculated on closing balances, and the close can be moved. Three manoeuvres repeat: chasing receivables hard in the last days of the month, not replenishing inventory in the final week, and delaying payments a few days so they fall outside the period.
Collecting receivables lowers receivables and raises cash: the quick ratio and days to collect improve. Not replenishing inventory lowers inventory and improves turnover, even if it leaves the warehouse empty in the worst week of the quarter. Delaying payments props up cash but inflates current liabilities, so it dresses the flow and punishes the current ratio. None of the three creates value: they move the cut-off date.
The way to detect it is to look at the flow, not the snapshot. The cash flow statement for the following three months, the receivables ageing and the days payable to suppliers show whether the improvement held. If closing cash is not repeated the next month, the ratio was measuring the date, not the business.
Operating metrics that explain the financial ones
Financial ratios say what happened; operating metrics say why. Four are enough to start: inventory turnover by item, inventory accuracy (physical count against the system), service level (orders shipped complete and on time) and days to collect by customer.
The link is direct. If gross margin falls, the cause is usually uncontrolled discounts, shrinkage, or a sales mix that moved toward lower-margin products. If days of inventory rise, the cause is items bought in excess or that stopped selling. If service level drops, the sale is lost and net margin records it a month later, when nothing can be done about that order.
A dashboard that is only financial arrives late. One that includes two or three operating metrics lets you act before the close confirms the problem.
The dashboard that fits on one page
If the dashboard has forty ratios, nobody reads it and the meeting drowns in detail. Eight or ten are enough: two on liquidity, two on leverage, two on efficiency and three or four on profitability. Each line carries the month's value, the same month a year earlier, the target and a trend arrow.
And an owner per line. A ratio with no owner does not move, because everyone assumes someone else is watching it. Frequency matters too: liquidity and efficiency are reviewed monthly because they change fast; leverage and profitability can take a quarterly review. Reviewing everything every week turns the dashboard into noise, and noise gets ignored.
Common mistakes: the symptom, the cause and the cost
The mistakes that repeat most are not about formulas, they are about reading. And almost all of them have the same effect: they give a quick answer to a badly posed question.
| Mistake | How it shows up | What it costs |
|---|---|---|
| Comparing against an unsourced average | "We are below the industry" | Decisions built on a reference nobody can reproduce |
| Reading a single period | The ratio "improved" against last month | Confusing seasonality with trend |
| Mixing a balance with a flow | Closing receivables against twelve-month sales | Days to collect that do not match reality |
| Using 360 and 365 on the same dashboard | Two versions of the same ratio | Arguments about figures, not about the business |
| Treating EBITDA as cash | "The operation generates this much" | Missing investment and working capital |
| Celebrating a high ROE | ROE rises at the same time as debt | Rising risk read as efficiency |
An honest closing note before you decide
None of this replaces the accountant. Ratios are calculated on financial statements someone has to review, and decisions on debt, pricing or investment have effects a dashboard cannot show. If the business is highly seasonal, if it just made a large investment, or if it is in restructuring, the closing snapshot misleads and the full series should be read with someone who knows the detail.
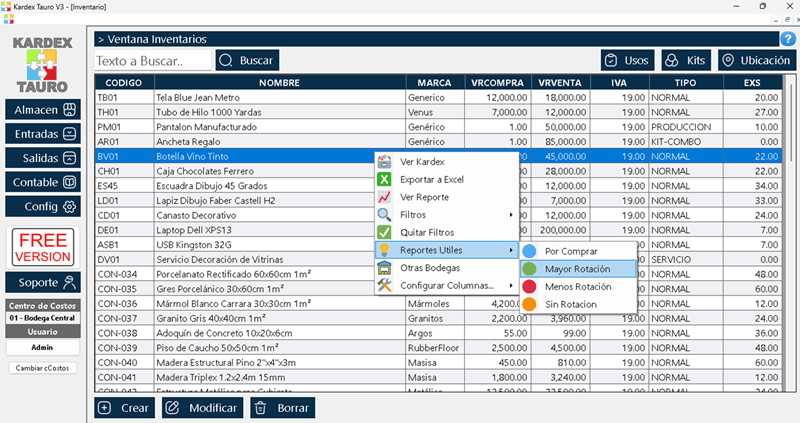
What any small-business owner can do is pick nine ratios, calculate them the same way every month and read them as a trend. That habit changes more decisions than any tool. A well-fed inventory and invoicing system provides the raw material; at that point, Kardex Tauro keeps receivables, inventory and sales in the same place, which is the condition for ratios to be calculated without rebuilding figures by hand.