Kardex example
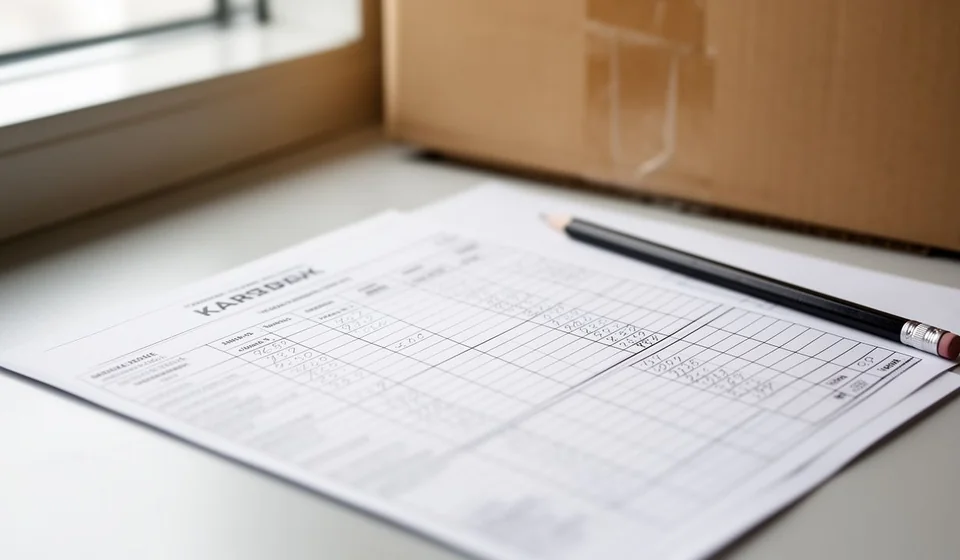
Kardex example
If you are searching for a kardex example, you probably already know what a kardex is, but you still need to see what a finished one looks like, with real numbers and every column in place. The short answer: a kardex is a table that records, in chronological order, all the inflows and outflows of a product, together with the available balance and its value. In this article you will find three complete, verifiable examples: a merchandise kardex for a store using the weighted average method (jeans), a basic warehouse kardex with inflows, outflows and balance, and a physical kardex card with all its fields. Each table is designed so you can check the numbers yourself: add up the columns and the final balance ties out. The three examples use the same structure most businesses work with, so you can use them as a template: copy the table, change the product name, the dates and the documents, and you will have your own working kardex.Example 1: weighted-average merchandise kardex for a store
The most useful example for a store is a valued kardex using the weighted average method. It is called that because every time merchandise enters at a different cost, the average cost is recalculated: the total value on hand is divided by the total number of units. Later sales leave at that average cost rather than at the price of each individual purchase, which keeps the cost of sales from jumping from one day to the next. Example data: product jeans, SKU JEAN-32, unit of measure: unit. Values are shown in dollars ($). The period runs from March 1 to March 30 and there are eight records: the opening balance, four purchases and three sales.| Date | Detail / concept | Document | Inflows (units) | Inflows: unit cost ($) | Inflows: value ($) | Outflows (units) | Outflows: unit cost ($) | Outflows: value ($) | Balance (units) | Balance: unit cost ($) | Balance: value ($) |
|---|---|---|---|---|---|---|---|---|---|---|---|
| Mar 01 | Opening balance | – | – | – | – | – | – | – | 10 | 45,000 | 450,000 |
| Mar 03 | Purchase from Andean Textiles | PI 0012 | 20 | 46,500 | 930,000 | – | – | – | 30 | 46,000 | 1,380,000 |
| Mar 06 | Retail sale | SI 0145 | – | – | – | 12 | 46,000 | 552,000 | 18 | 46,000 | 828,000 |
| Mar 10 | Purchase from Andean Textiles | PI 0018 | 12 | 47,000 | 564,000 | – | – | – | 30 | 46,400 | 1,392,000 |
| Mar 15 | Retail sale | SI 0161 | – | – | – | 20 | 46,400 | 928,000 | 10 | 46,400 | 464,000 |
| Mar 20 | Purchase from El Hilo Garments | PI 0026 | 30 | 45,600 | 1,368,000 | – | – | – | 40 | 45,800 | 1,832,000 |
| Mar 25 | Retail sale | SI 0189 | – | – | – | 15 | 45,800 | 687,000 | 25 | 45,800 | 1,145,000 |
| Mar 30 | Purchase from El Hilo Garments | PI 0035 | 25 | 46,200 | 1,155,000 | – | – | – | 50 | 46,000 | 2,300,000 |
How to read a kardex: what each column means
Formats vary from one business to another, but the columns of a kardex always tell the same story. Here is what each one means:- Date: the day the movement happened. A kardex is read in chronological order: each row is a new fact about the same product.
- Detail or concept: what happened on that date: a purchase, a sale, a return, a transfer, an adjustment or shrinkage.
- Document: the number of the invoice, voucher or delivery note that supports the movement. It is the proof that the entry is real and lets you trace it later if needed.
- Inflows: the units that come in (purchases, customer returns, transfers into the store), with their quantity, unit cost and total value.
- Outflows: the units that go out (sales, returns to suppliers, internal use, shrinkage), valued at the cost in effect at the time.
- Balance: the accumulated stock after each movement. This is the column that answers how much is available.
- Unit cost and value: value is always quantity x unit cost. Entries use the purchase price; outflows and balance use the current average cost.
Example 2: basic warehouse kardex with inflows, outflows and balance
When the only thing that matters is the number of units, as with office supplies, inputs or spare parts, a kardex without values is used, with three movement columns: inflows, outflows and balance. It is the simplest format and also the fastest to audit. Example data: ream of letter-size paper, unit of measure: ream, general warehouse, month of March.| Date | Detail | Document | Inflows | Outflows | Balance |
|---|---|---|---|---|---|
| Mar 01 | Opening balance | – | – | – | 25 |
| Mar 04 | Purchase from Central Paper | PO 1024 | 40 | – | 65 |
| Mar 07 | Issue to accounting | Requisition 210 | – | 12 | 53 |
| Mar 12 | Purchase from Central Paper | PO 1030 | 30 | – | 83 |
| Mar 18 | Issue to human resources | Requisition 227 | – | 15 | 68 |
| Mar 24 | Purchase from Central Paper | PO 1041 | 50 | – | 118 |
| Mar 29 | Issue to receiving | Requisition 245 | – | 18 | 100 |
Example 3: physical kardex card and its fields
Before inventory software existed, the kardex was kept on cardboard cards called kardex cards, filed by product in alphabetical or code order. Many small warehouses still use them. A kardex card is a pre-printed card or sheet with a header that identifies the item and a body where movements are written by hand; it also has control boxes and a space for the signature of the person recording the entries. Using the same merchandise as Example 1, the header of the card would be filled in like this: card No. 021, product: jeans, code: JEAN-32, unit: unit, location: warehouse 2, shelf A3, maximum stock: 60, minimum stock: 10, person in charge: warehouse keeper. And the body of movements would look like this:| Date | Concept | Document | Inflows | Outflows | Balance | Signature |
|---|---|---|---|---|---|---|
| Mar 01 | Opening inventory | – | 10 | – | 10 | M. R. |
| Mar 03 | Purchase | PI 0012 | 20 | – | 30 | M. R. |
| Mar 06 | Sale | SI 0145 | – | 12 | 18 | M. R. |
- Header or item identification: code or SKU, product name, unit of measure (unit, kilo, meter, box) and physical location (warehouse, shelf, bin).
- Control data: agreed maximum and minimum stock, usual supplier and, in some formats, the valuation method used.
- Body of movements: date, concept or detail, document number, inflows, outflows and balance, always in chronological order.
- Closing and control: signature of whoever records each movement and an observations box for notes such as returns or adjustments.
Why it is useful to look at the kardex history
The real value of a kardex is not in the last row but in the complete history of the product. Keeping that history organized is useful for:- Calculating the cost of sales and the real profit per product, because every outflow is valued at its cost.
- Detecting shrinkage, theft or errors: if the kardex says there should be 50 pairs of jeans and the physical count shows 46, the difference stands out and can be investigated in time.
- Deciding how much and when to buy, by watching rotation: how much sells per week and how fast each SKU runs out.
- Resolving claims and returns: with the date and document number you can reconstruct exactly what happened with a sale or a purchase.
- Supporting accounting and audits, because the valued ending inventory of the kardex is the basis of the balance sheet and of taxes.