Annual business budget template in Excel

Annual business budget template in Excel
Most small businesses can tell you what they sold last month, but very few can tell you what they expected to sell. That gap, which sounds like a bookkeeping detail, is what decides whether the year closes calmly or with surprises. When there is no written plan, every expense justifies itself and every month is judged by how the cash felt, not by what had been foreseen.
The annual budget is that plan: a list of income and expense lines spread month by month, with the figure you expect to reach in each one. It does not predict the future and it does not replace bookkeeping; it puts in writing what it is reasonable to expect and turns big decisions, such as hiring, buying stock, renting or spending on advertising, into commitments with a number attached. Reviewing it every month turns a hunch into a concrete conversation: what was met, what drifted and what gets corrected.
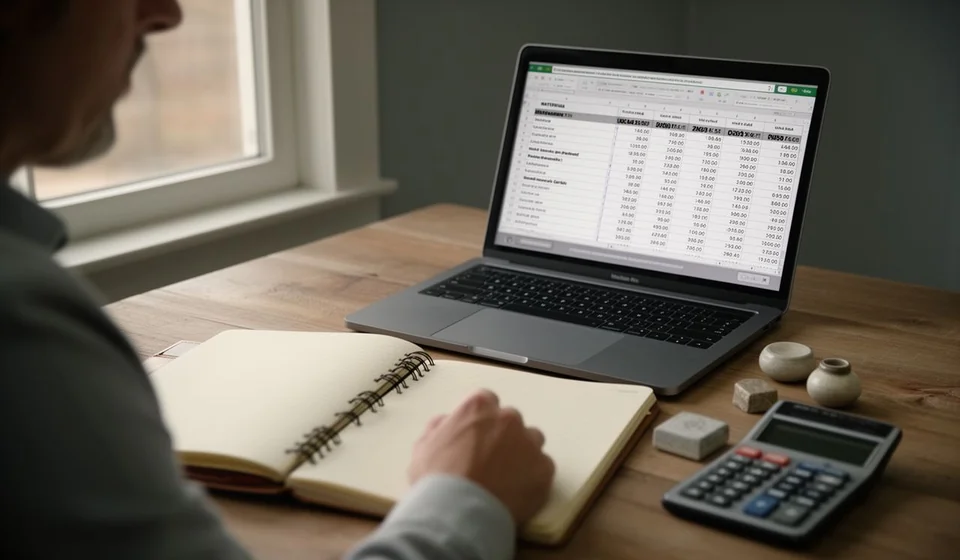
This annual business budget template in Excel is a working file with the twelve months in columns, income and expense lines in rows and totals calculated automatically. You can build it in a single sitting and adjust it whenever an assumption changes: a price, a contract, a new fixed cost. Read on to see how it is filled in, what each column looks at and when it makes sense to leave it behind.
⬇ Download the template (Excel .xlsx)What an annual budget is and who it is for
An annual budget is what the business plans to do during the year, expressed in money. It looks like an income statement, but it faces forward: instead of recording what happened, it records what is expected to happen. Every line answers to an assumption: how much you plan to sell, at what pace you collect, what the stock costs, what you pay in payroll, rent, utilities, transport, advertising and professional fees. The budget is therefore a plan by line item and by month.
It is mainly for people who make decisions without a finance department behind them. It gives the owner a point of comparison to know whether the month is going well or badly before it ends. It lets the administrator anticipate the months when fixed costs weigh more than sales. It shows the sales area the target that supports the structure. And it shows anyone reviewing the numbers, a bank or a partner, that the business is planned with method and not just with enthusiasm.
The template is meant for small and medium businesses in any sector: shops, workshops, distributors, restaurants, clinics and professional services. It does not require advanced accounting knowledge, only knowing what was sold and what was spent over the past few months, because that history is the best base for forecasting. If the business is just starting and has no history, build the plan on the most conservative assumptions you can support.
The budget is a plan; the income statement is what happened
It is worth not confusing the two, because they look alike in shape and differ in time. The budget is what you expect: it is built before the year starts and corrected when an assumption changes. The income statement is what happened: it is built afterwards, with the real figures for the month, and it no longer changes. The first is a promise of work; the second is a photograph. The same payroll line can appear in both documents and mean different things: in the budget it is what you plan to pay; in the income statement, what was actually paid.
The value appears when the two are read together. A budget that is never compared with reality ends up as a decorative document; real figures without a budget cannot say whether the month was good or bad, because there is nothing to measure them against. So keep the plan in the sheet and, as each month closes, read the result next to what actually happened: the deviation, up or down, is the most valuable information in the exercise.
It is also worth telling it apart from the cash flow forecast, which follows the cash balance month by month and warns you when money will be short. The budget works by line item and by result: it says whether the business earns or loses with the plan it has, not how much cash is available on each date. A plan with a positive result can still have months without cash, and a month with plenty of cash can hide a poor result. The two formats complement each other; they do not replace each other.
What the template includes
| Block | What it brings |
|---|---|
| Income | Sales, services and other income, month by month. |
| Costs and expenses | Stock, payroll, rent, utilities, transport, advertising, professional fees and other. |
| Totals | Total income, total costs and expenses, and the result for the month. |
| Running result | The running total of the result, month by month, to see how the year is progressing. |
| Year summary | Full-year figures and the monthly average per line item. |
| Layout | Twelve months in columns plus a full-year total column. |
The sheet does not carry sample figures: it is delivered blank so that each business writes its own. Nor does it ask for third-party data or official documents. All it needs are the decisions of someone who knows the business.
The columns on the sheet
| Column | What is written there |
|---|---|
| Line item | The name of the item: sales, services, stock, payroll, rent, utilities, transport, advertising, professional fees and other. |
| Jan, Feb, Mar, Apr, May, Jun | The first six months of the year, each with its planned figure. |
| Jul, Aug, Sep, Oct, Nov, Dec | The remaining six months. |
| Total for the year | The sum of the twelve months of that row. |
The rows are grouped into income, costs and expenses, result for the month and running result. The total and result rows calculate themselves: you only write the line items and the figures for each month. If a month is left blank, the total simply does not add it.
How the calculation works: January, February and the running total
The calculation is a simple subtraction per month and a running sum between months. With the figures in the example, January starts with sales of 5,000,000 and costs and expenses of 4,500,000: stock 2,200,000, payroll 1,300,000, rent 700,000 and utilities 300,000. The result for the month is 500,000 and so is the running total, because it is the first month of the year.
| January line item | Value |
|---|---|
| Stock | 2,200,000 |
| Payroll | 1,300,000 |
| Rent | 700,000 |
| Utilities | 300,000 |
| Total costs and expenses | 4,500,000 |
In February sales rise to 5,500,000, but stock goes from 2,200,000 to 2,700,000 and total costs and expenses reach 5,200,000. The result for the month falls to 300,000, while the running total rises to 800,000, because it gathers both months. This is the point that is hardest to see in practice: a month can sell more than the previous one and still leave less result.
| Concept | January | February |
|---|---|---|
| Sales | 5,000,000 | 5,500,000 |
| Costs and expenses | 4,500,000 | 5,200,000 |
| Result for the month | 500,000 | 300,000 |
| Running result | 500,000 | 800,000 |
The running result is what tells you whether, with the months added up, the year is still on track. The year summary repeats the exercise across the twelve months and adds the monthly average, which is the figure to compare against the plan when a single month looks odd. One weak month does not ruin the year; a running total that falls three months in a row does demand a decision.
Step by step
- Gather the last twelve months of sales and expenses. If you do not have the full year, use the six months you do have: the point is to start from your own figures, not invented assumptions.
- Set the starting point for sales. Take the average of the months you gathered and adjust it for what you already know about the year ahead: a new contract, a customer leaving, a busy season.
- Spread sales across the months. Do not put the same figure in all twelve if the business is seasonal: slow and strong months exist and they should show up in the plan.
- Load the cost and expense lines. Stock usually moves with sales; payroll, rent and utilities behave like a floor that gets paid even in the worst month.
- Check the monthly result and the running total. If the running total drops at some point, do not hide it: adjust the plan or prepare the decision, whether that means financing, delaying a purchase or reviewing prices.
- Update the assumptions every month. The budget is corrected when a relevant figure changes; if it is never corrected, it stops working as a reference.
Tips and common mistakes
- Do not reuse last year's file without reviewing it: prices and costs change, and an inherited plan hides the mistake.
- Do not mix plan and actuals in the same column. Leave the plan clean and compare separately, so you always know which figure is which.
- Do not forget the expenses paid once or twice a year, such as insurance, maintenance and obligations of the business itself: spread them across the months so they do not surprise you.
- Do not budget stock as a fixed percentage of sales without checking purchase prices: a supplier raising prices changes the whole line.
- Do not leave the budget to the person who collects alone: whoever buys and whoever sells should see the plan, because they are the ones executing it.
- Do not abandon the file in March. A budget that is never reviewed during the year is a decorative document.
When to move to software
While the business is small and the line items fit on one sheet, the Excel file is enough and cheap: it can be read at a glance, it does not depend on the internet and anyone can open it. That changes when the budget starts to cross with real operations, with purchases, sales, receivables and banks, and somebody has to copy figures from one side to the other every week. That is when plan and reality drift apart, and the budget loses exactly what made it useful: the comparison.
A management system such as Kardex Tauro avoids that manual copying, because sales, purchases and inventory movements are already recorded and feed the monthly reports without being typed again. The Excel file remains the natural place to think the plan through; the system is the place where you check whether the plan is being met. Once the business passes a hundred movements a month or several people need to consult the same figure, the decision is no longer about saving a spreadsheet: it is about working with information you can trust.
An annual budget does not cost money: it costs one afternoon. And it gives back, every month, the chance to decide with a cool head instead of reacting when there is no room left. Fill it in with your own figures and compare it with reality: that comparison, repeated twelve times, is the difference between running a business and knowing how to run it.
⬇ Download the template (Excel .xlsx)