Sales pipeline template for Excel

Sales pipeline template for Excel
Most small firms do not run out of leads. They run out of any clear idea of what those leads are worth. In the file that has been passed around for years, the salesperson lists six open conversations, adds up the amounts and quotes a figure that sounds impressive and means nothing: a quote sent yesterday sits beside an order the customer already approved and is only waiting for someone to raise the purchase order.
When the owner asks how much will actually close this month, the honest answer needs two numbers. The first is what sits in the pipeline, and that is plain arithmetic. The second is what is likely to close, and that one forces a commitment: give every stage a probability and accept that a deal in first contact is not worth the same as one already arguing over the final price.
This template handles the second sum. One row per opportunity, one probability per stage, one column that multiplies the two. What is left at the bottom are two totals meant to be read together: the whole pipeline and the weighted pipeline. The gap between them is exactly the gap between optimism and a budget.
⬇ Download the template (Excel .xlsx)What the format is and who it suits
It is a sales tracking sheet, not a CRM. It sends no email, sets no reminders and connects to nothing. What it does is put every live deal into one view, with its stage, its value and the next concrete step. That sounds modest, and it is precisely what most small businesses cannot produce when the owner asks for the number.
It suits the company that sells by quotation on a long cycle: distribution, hardware, technical services, workshops, a small estate agency, a trading business that depends on three or four large accounts. It also suits the salesperson who keeps everything in their head and needs to write it down before it slips away, even when they work alone and answer to nobody but their own pocket.
It is not for recording closed sales — the sales book does that — and not for invoicing. Only deals that are still breathing belong here. Once a deal is won or lost it is marked in the status column and stops counting. That small act is what keeps a pipeline honest: a pipeline that never loses anything is not a pipeline, it is a wish list.
The format also works as an internal agreement. When the salesperson and the owner argue over the same sheet, the conversation stops being about impressions and becomes about specific rows: why this deal is still at proposal after six weeks, why that one is worth five million and has no next contact date, why the largest one is the one nobody has touched this month.
What the template contains
| Element | Where it sits | What it is for |
|---|---|---|
| Opportunity log | Main sheet, one row per deal | Holds the customer, the stage, the value and the next step for each deal |
| Summary header | Top band of the sheet | Shows how many deals are still open, the estimated total and the weighted total |
| Weighted value column | Calculated on every row | Multiplies the estimated value by the probability attached to the stage |
| Status column | Three-option list | Open, won or lost; the last two drop out of the summary |
| Stage and probability block | Lists sheet | Sets the name of each stage and its weight; edited without touching formulas |
| Next action alert | Conditional formatting on the date | Highlights the deals whose contact date has already passed |
The columns, one by one
| Column | What you type | What is calculated |
|---|---|---|
| Date | The day the opportunity entered the pipeline | Nothing; it measures how long the deal has been open |
| Customer | The name of the customer or the company | Nothing |
| Opportunity | What is being sold, in a few words | Nothing |
| Stage | One of the stages on the list | Pulls in the probability tied to that stage |
| Estimated value | The amount on the current quote, without discounts that were never approved | Nothing |
| Probability | Filled in from the stage, or adjusted by hand with a reason | Read from the stage list |
| Weighted value | Never typed by hand | Estimated value times probability, divided by one hundred |
| Next action | The concrete task: call, send a sample, visit the plant | Nothing |
| Next action date | The day it has to happen | Triggers the alert once the date passes |
| Owner | Who is holding the ball right now | Nothing |
| Status | Open, won or lost | Decides whether the row counts in the summary |
How the calculation works, figure by figure
The only column with a real formula is Weighted value, and the logic fits into one sentence: if ten out of every hundred deals like this one close, then this one is worth ten percent of its amount. Everything else is built on that idea, including whatever stages the company decides to invent. There is no statistical model and no magic: one multiplication and a judgement about how much weight each stage carries.
Choosing the probabilities is the part worth arguing about, and it should be argued with data. If over the past year eight out of every twenty proposals sent were won, the proposal stage carries forty percent and not the sixty everyone remembers. Until there is history, use the template values and review them each quarter against what actually happened.
| Customer | Stage | Estimated value | Probability | Weighted value |
|---|---|---|---|---|
| Andean Distributors | Prospecting | 4,000,000 | 10 percent | 400,000 |
| El Roble Hardware | First contact | 2,100,000 | 25 percent | 525,000 |
| Sunrise Bakery | Proposal | 2,900,000 | 50 percent | 1,450,000 |
| San Jorge Warehouse | Negotiation | 5,000,000 | 75 percent | 3,750,000 |
| Pine Street Workshop | Closing | 2,000,000 | 90 percent | 1,800,000 |
| Total | Five open | 16,000,000 | 7,925,000 |
Five rows, five different stages. The first is a distributor that has only asked for information: 4,000,000 on the table and a low probability, so 4,000,000 times 10 gives 40,000,000 and, divided by a hundred, 400,000. The second has had its first conversation, is worth 2,100,000 and, at a quarter probability, weighs 525,000. The third has received a proposal for 2,900,000 and sits halfway along: 1,450,000.
The fourth is the biggest deal in the pipeline at 5,000,000, and also the most advanced of the first three: at three quarters it contributes 3,750,000, nearly half the weighted total. The fifth is practically closed, with the customer only waiting for a delivery date; its 2,000,000 at ninety percent is worth 1,800,000. None of the five is a sale yet, and still three of them carry almost the entire forecast.
Add up the estimated value column and you get 16,000,000. Add up the weighted value column and you get 7,925,000. That is the whole story of the pipeline: there are sixteen million in it and a little under eight million that can be defended in front of a bank or a partner. The difference is not pessimism; it is the part of the business that still depends on the customer saying yes.
Step by step
- Open the sheet and look at the stage list. If your business sells in five steps, keep them; if it sells in three, delete the extra ones and split the weight across the ones that remain.
- Write one row per live opportunity. Only the live ones: whatever is already closed belongs in the sales book, not here.
- Pick the stage from the list and let the probability fill itself in. If one particular deal deserves a different weight, change it by hand and write the reason in the next action.
- Check that the estimated value matches the current quote. A stale price drags the whole summary with it, and nobody notices until the customer complains.
- Write a next action with a verb and a date. "Call Tuesday to confirm the deposit" works; "follow up" does nothing at all.
- Once a week, move forward what moved, mark as lost what went cold and add whatever came in. Ten minutes, always on the same day.
- When you have to commit to a purchase or promise a hire, look at the weighted total rather than the estimated one. The second is an illusion; the first is a promise you can keep.
The mistakes that keep coming back
- Leaving closed deals in the sheet. A won sale that is still listed inflates the pipeline and hides the lack of new work.
- Making up probabilities, different every week, so the final number looks good. Probability comes from the stage and is only changed with a written reason.
- Mistaking the estimated total for money available. They are two different figures and only the second one helps you decide.
- Logging three rows for the same customer because three quotes went out. That is one opportunity with three price versions, not three opportunities.
- Leaving the next action date empty. A deal with no next step is not open: it is forgotten.
- Emailing the file around until five versions exist. If it is shared, keep it to a single file with a single person editing.
When it is worth moving to software
With one salesperson and thirty opportunities, the sheet is more than enough and works better than many tools. The moment to change arrives for three concrete reasons: there are several salespeople and each one needs to see their own deals without seeing everyone else's; you need the history of what happened to a negotiation two years ago; or the file travels by email and nobody knows which version is the good one.
If that is where you are, a system with a pipeline, per-user permissions and an activity log solves what a spreadsheet cannot. Kardex Tauro covers that side and also inventory and invoicing, which is what usually comes next. If the business is not there yet, there is no rush at all: the template does the work and, more importantly, builds the habit, which is the hard part.
The sheet, in plain sight
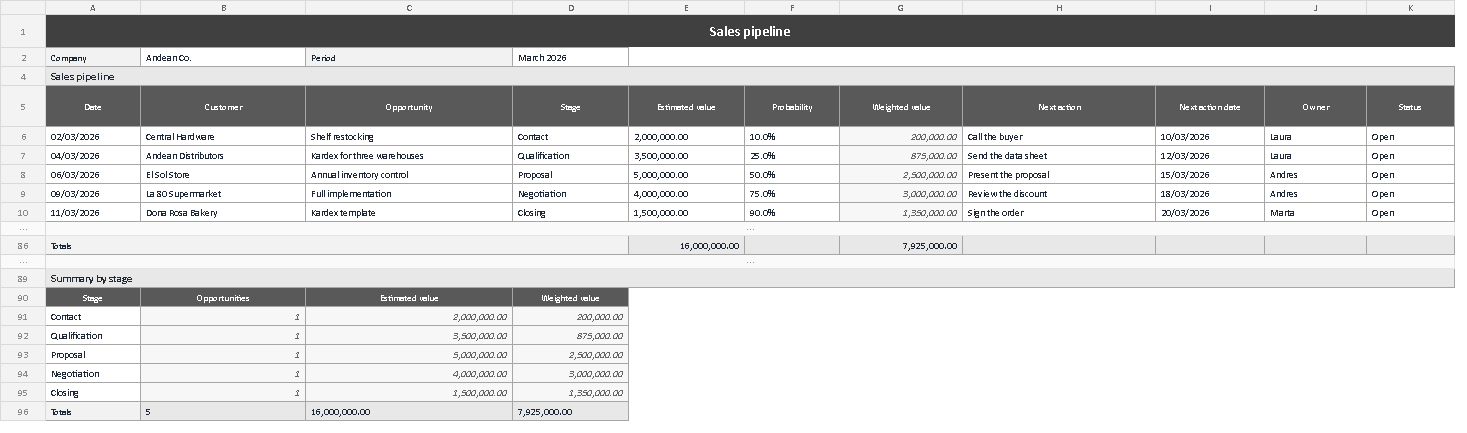
The capture shows the sheet exactly as it downloads. The summary band sits at the top with the open deals and the two totals; below it, the log with one row per negotiation. Three details are worth checking before you start typing: that the weighted value column carries a formula on every row, that closed deals are flagged and no longer count, and that no open opportunity has a next action date that is empty or overdue.
A weighted pipeline does not predict the future. It only separates what can be promised from what can be dreamed, and that separation is what stops a small business from signing a lease on sales that do not exist yet. Download it, fill it with the opportunities you already have and compare the two totals: the difference between them is usually the most useful conversation of the month.
⬇ Download the template (Excel .xlsx)